Part III: Blockbusters, Stinkers and Upsets
So in Part I we found that what made 2017 great was the resurgence of Victorian teams. This was evident in increased match attendances. In Part II, we found that attendance is driven by match-ups between teams that are higher up the ladder but also that they have similar numbers of wins to date. Therefore the hypothesis is that 2017 was also great because the competition was more even, and there were more matches between evenly matched teams.
Let's look at the latter first up, match-ups between evenly matched teams. We see below that the mean difference in ladder positions per match has been high in recent times, although not a historical record (the all-time record was set in 1971). From 2013 to 2016 inclusive, the median difference was 12 points (3 wins), which was a record for consecutive seasons. This indicates a period of dull footy, a lack of contests between closely matched teams. The great news is that this came back to a median difference of 8 points in 2017, though the best season in recent times was actually 1997. In that season, even the 15th placed Hawthorn managed 8 wins.
Figure 8: Home team difference in points to away team prior to the match. The first quarter of the season is excluded to allow enough time for the competition to settle.
To illustrate this increase in competitiveness further, we see below that there were relatively more matches between teams on the same points or 1 or 2 wins difference. And there were no matches between teams that had 32 points/8 wins+ in 2017. In contrast, 2013 was extraordinarily dull when Hawthorn and Geelong dominated, while Melbourne and GWS were uncompetitive.
Figure 9: Recent distribution of difference in points between the home team and away team prior to the match. The first quarter of the season is excluded to allow enough time for the competition to settle.
And it can vary across the season too. 2012, 2013 and 2016 had some truly boring rounds of football. In contrast, 2017 was consistently competitive for longer. Even Round 18 was great with only 1 predictable match, Essendon (32 pts to date) vs North Melbourne (16 pts), a match that Essendon won by 27 points. 2017 was a tough year for tipping and this is the mark of a great season.
Figure 10: Mean difference in points each round. The first quarter of the season is excluded to allow enough time for the competition to settle.
Now, I did say that “salivating contests” meant not only closely matched teams but also high ranking (Q clash anyone?). We see below that the rate of games between top 8 teams is reasonably stable across seasons, more an arithmetic reality if anything. If top 8 teams constantly played each other then bottom 8 teams would also playing each other and, by definition, there would inevitably be movement up and down the ladder.
Figure 11: Match-up types by season. The first quarter of the season is excluded to allow enough time for the competition to settle.
Putting both of these factors together, points differential and wins to-date, we see that "blockbusters" (two top 8 teams separated by no more than 2.5 wins) aren’t as frequent as we might imagine. 2017 was good but no better than the previous two seasons overall (there were 27 in 2016 as well). However, there were three rounds when there were 3 blockbusters, the last in Round 20 when Geelong hosted Sydney, GWS hosted Melbourne, and Adelaide played Port Adelaide.
Figure 12: Blockbusters by round by season. The first quarter of the season is excluded to allow enough time for the competition to settle.
And as for blockbusters on a Friday night, “the big stage” (not to be confused with the Grand Final which is “the big dance”), the AFL managed to fixture 7 of them, a good number but not as many as 2016, 9. C'mon AFL, you can do better!
Figure 13: Friday night blockbusters by round by season. The first quarter of the season is excluded to allow enough time for the competition to settle.
But at least the AFL managed to avoid a Friday night stinker in 2017 (a stinker being when the difference between teams is 4.5 wins or more). The last one was in round 21, 2016 when the Doggies, seventh, hosted Collingwood, twelfth. Only 35,000 turned up at Docklands.
Figure 14: Friday night stinkers by round by season. The first quarter of the season is excluded to allow enough time for the competition to settle.
Interestingly, the Dogs only got home by 3 points that game, which goes to show that the difference in wins-to-date isn’t always everything. Even if it’s not a clash of titans, I’m sure that many of us tune in anyway, hoping for a close game, if not an upset. The prospect of an upset is a wonderful element of this game, and sport more generally. Potentially, this is what also made 2017 a great season, that there were more upsets than before.
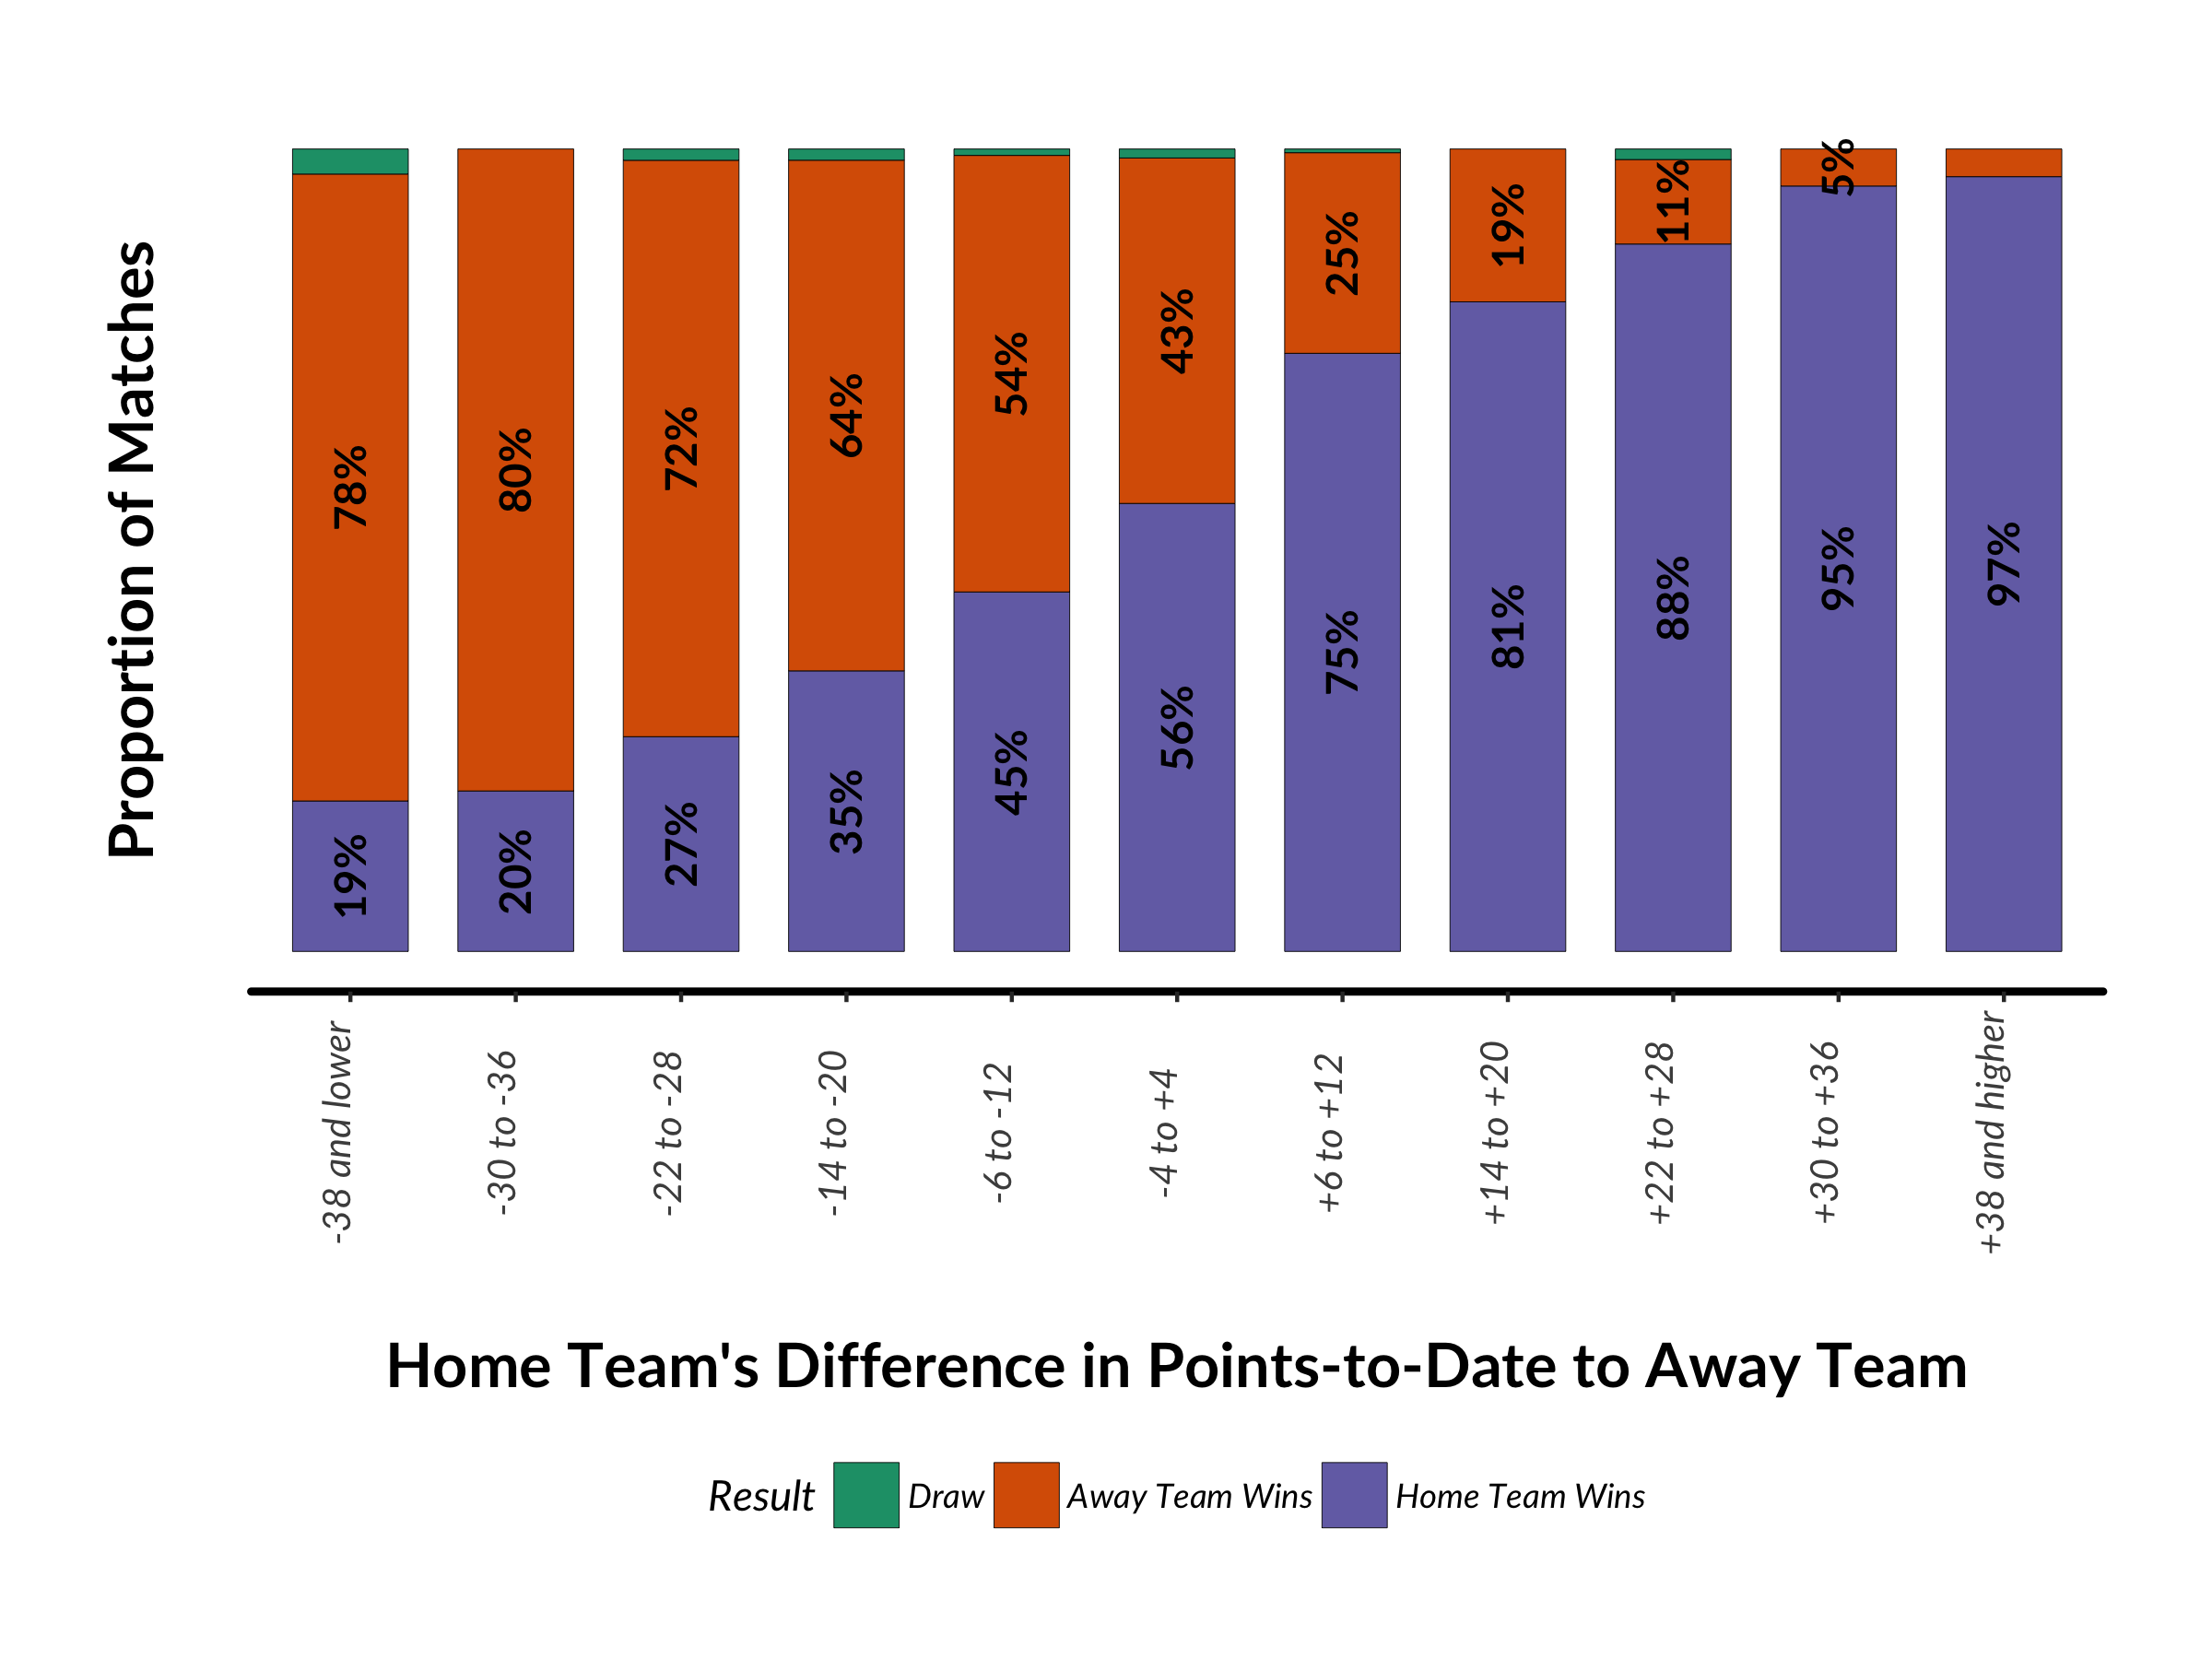
To set the scene, here is the overall likelihood of victory based on wins-to-date alone. We see that the chances of the away team getting up is pretty slim once the difference in ladder points gets above 20. On the other hand, home teams do have a small but reasonable chance of winning even though they are way below the other team in terms of wins-to-date. And fans seem to know this, which is why fans turn up to some extent despite a mismatch.
Figure 15: Match results by home team's difference in points-to-date to away team. Filtered to 2006 onwards and the home team's official home ground. The first quarter of the season is also excluded to allow enough time for the competition to settle.
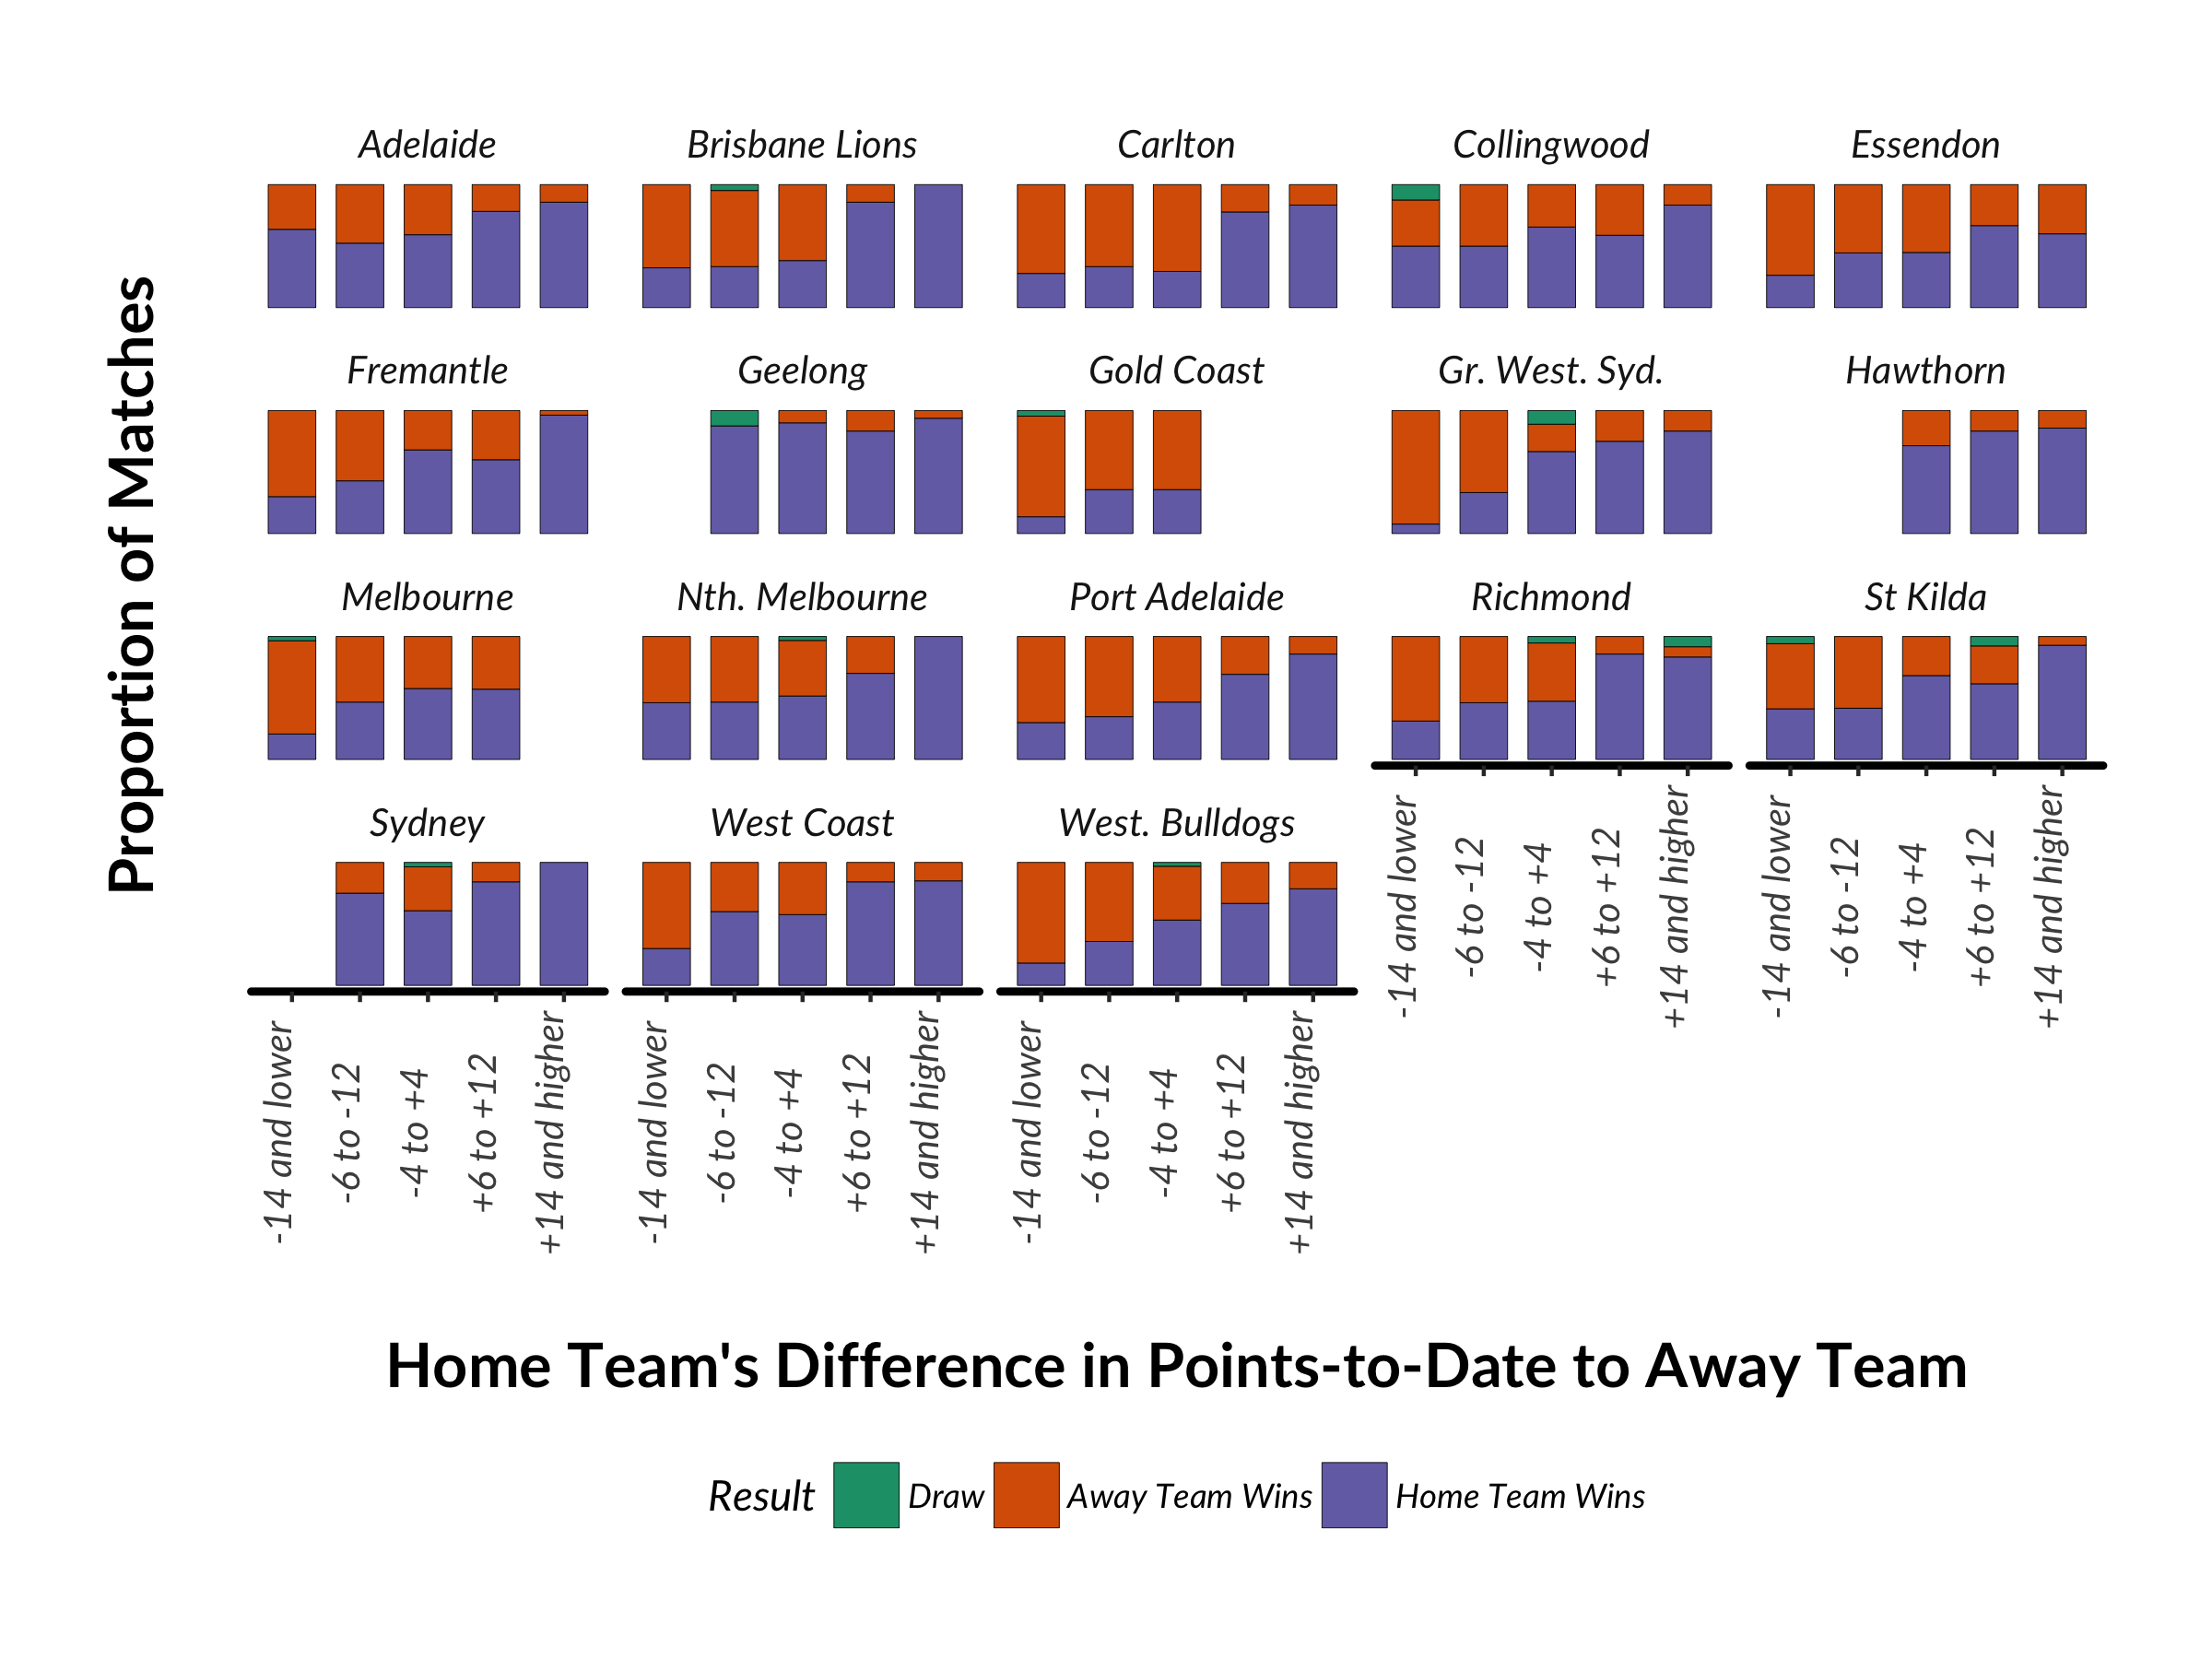
And here we see the result by team and how, regardless of the fewer number of wins, the home team still has a reasonable chance of winning. The largest fortress in terms of influence on results is clearly Kardinia Park. Regardless of whether the opposition is above or below them in terms of wins, the Cats win most of the time. And the fans know this, which is why we saw earlier that they turn up rain, hail or shine. Sydney, Adelaide, and Collingwood also like playing at home. The opposite is true for the Western Bulldogs and Essendon at Docklands. Even if they have more wins under their belt, the opposition still has a reasonable chance of victory.
Figure 16. Match results by home team's difference in points-to-date to away team for each home team. Filtered to 2006 onwards at a home team's official home ground. At least 5 matches need to have been played in each category. The first quarter of the season is also excluded to allow enough time for the competition to settle.
But what is of most interest is how the chance of winning based on ladder points differential has changed over time. We'd like to see that upsets were more becoming more likely.
The reality is that the chances of an upset are fairly steady in recent times. The chances of a home team upset (the dark red line) is steady. And the certainty of victory for a stronger home team (the dark green line) also seems to bounce around in recent times without a clear trend either way. However, it was only 79% in 2017 and hopefully go even lower in 2018. Fans of weaker teams can build their confidence of a win and subsequently turn up. And non-partisan fans have even more reason to watch the 27 hours of footy on television over a weekend.
Figure 17: Incidence of the home team winning by the home team's difference in points-to-date to the away team. The first quarter of the season is excluded to allow enough time for the competition to settle.
In this section, we looked at types of match-ups and the likelihood of the underdogs getting up. In 2017, it was very much about better match-ups than in the past, rather than more upsets. In Part IV, I'll look at a further idea, that 2017 was great because even though higher ranked teams have prevailed (as they have always done), at least it might have been a close contest.


