Part II: Drivers of Match Attendance
So it seems that the team’s ladder position has a lot to do with how many punters turn up. Makes sense, right? For most teams, this is true.
Below is how the ladder position of the home team relates to attendance from 2006 onwards. The number worth looking at initially is the R2, which is a number between 0 and 1, the higher the better. Low numbers (less than 0.3) are basically saying that there are many other factors other than ladder position that determine how many people turn up. This is the case for most teams except Brisbane, which loses 1,062 punters for every lower ladder position. We knew Queenslanders were a fickle bunch.
Figure 4: Attendance by prior ladder position, 2006 onwards. Main home grounds for each club only. Also excludes the first quarter of the season to allow for ladder position to better reflect performance.
Now, even though the R2 is not high, we do see negative relationships (there are just other factors that explain more of the variance in the data). Collingwood, for example, loses 1,500 punters for each lower ladder position. Richmond, 1,377, St. Kilda, 1,034, Port Adelaide, 1,114, Essendon, 1,012, Carlton, 1,007. However, there are teams with rusted-on supporters like Geelong and West Coast that will get the same attendance regardless of where they are on the ladder.
An extension to looking at ladder position is to look at the difference in prior rank between the two teams. Perhaps folks might be less inclined to turn up if their highly-ranked team is playing a cellar-dweller. Similarly, some folks might rather stay at home than watch their team get thumped.
Figure 5: Attendance by prior ladder position, 2006 onwards. Main home grounds for each club only. Also excludes the first quarter of the season.
The short answer is that difference in prior ladder position does not seem to matter much in its own right. Most R2 values are quite low. This is not to say it does not make a difference in conjunction with other factors, but supporters tend to turn up no matter how the opposition is ranked on the laddder.
Let’s skip a few steps and have a look at a large set of factors that may influence match attendance. And let’s evaluate these factors in combination with one another. We can do this by developing a predictive model of home ground match attendance, testing a range of contextual factors as predictors.
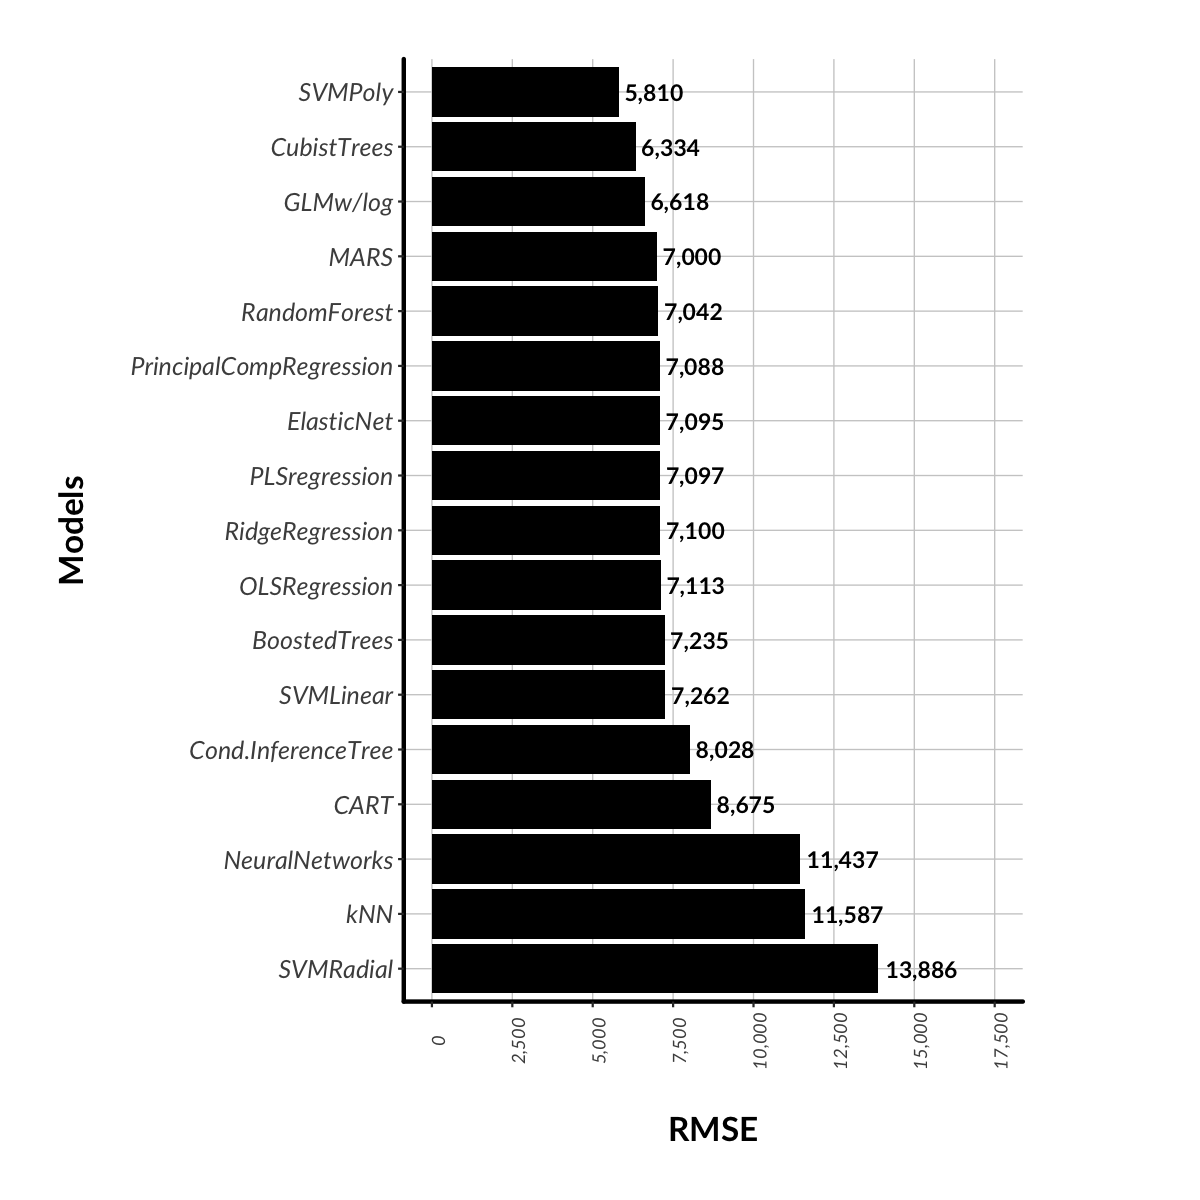
For the data scientists out there, it turned out that a Support Vector Machine model with a Polynomial kernel was the most accurate model - an RMSE of 5,810, meaning that the model predicts attendance plus/minus 5,810 people two thirds of the time. This does not seem particularly accurate but the model does have an R2 of 83%, meaning that the factors that are included in the model seem to explain 83% of the variability in the data.
In my opinion, 83% is a pretty good result and while I wouldn’t use this model for forecasting, it is enough to gain some understanding about what is driving attendance. My guess is that the next big factor that I’m missing here is the weather forecast for the day of the match (as opposed to actual weather). I’d suggest that this would have a significant bearing on attendance.
Now, one can’t readily interpret SVM models so I’m going to show you some co-efficients from a General Linear Model with a logarithmic link function. It also performed reasonably well with an RMSE of 6,618 and an R2 of 78%.
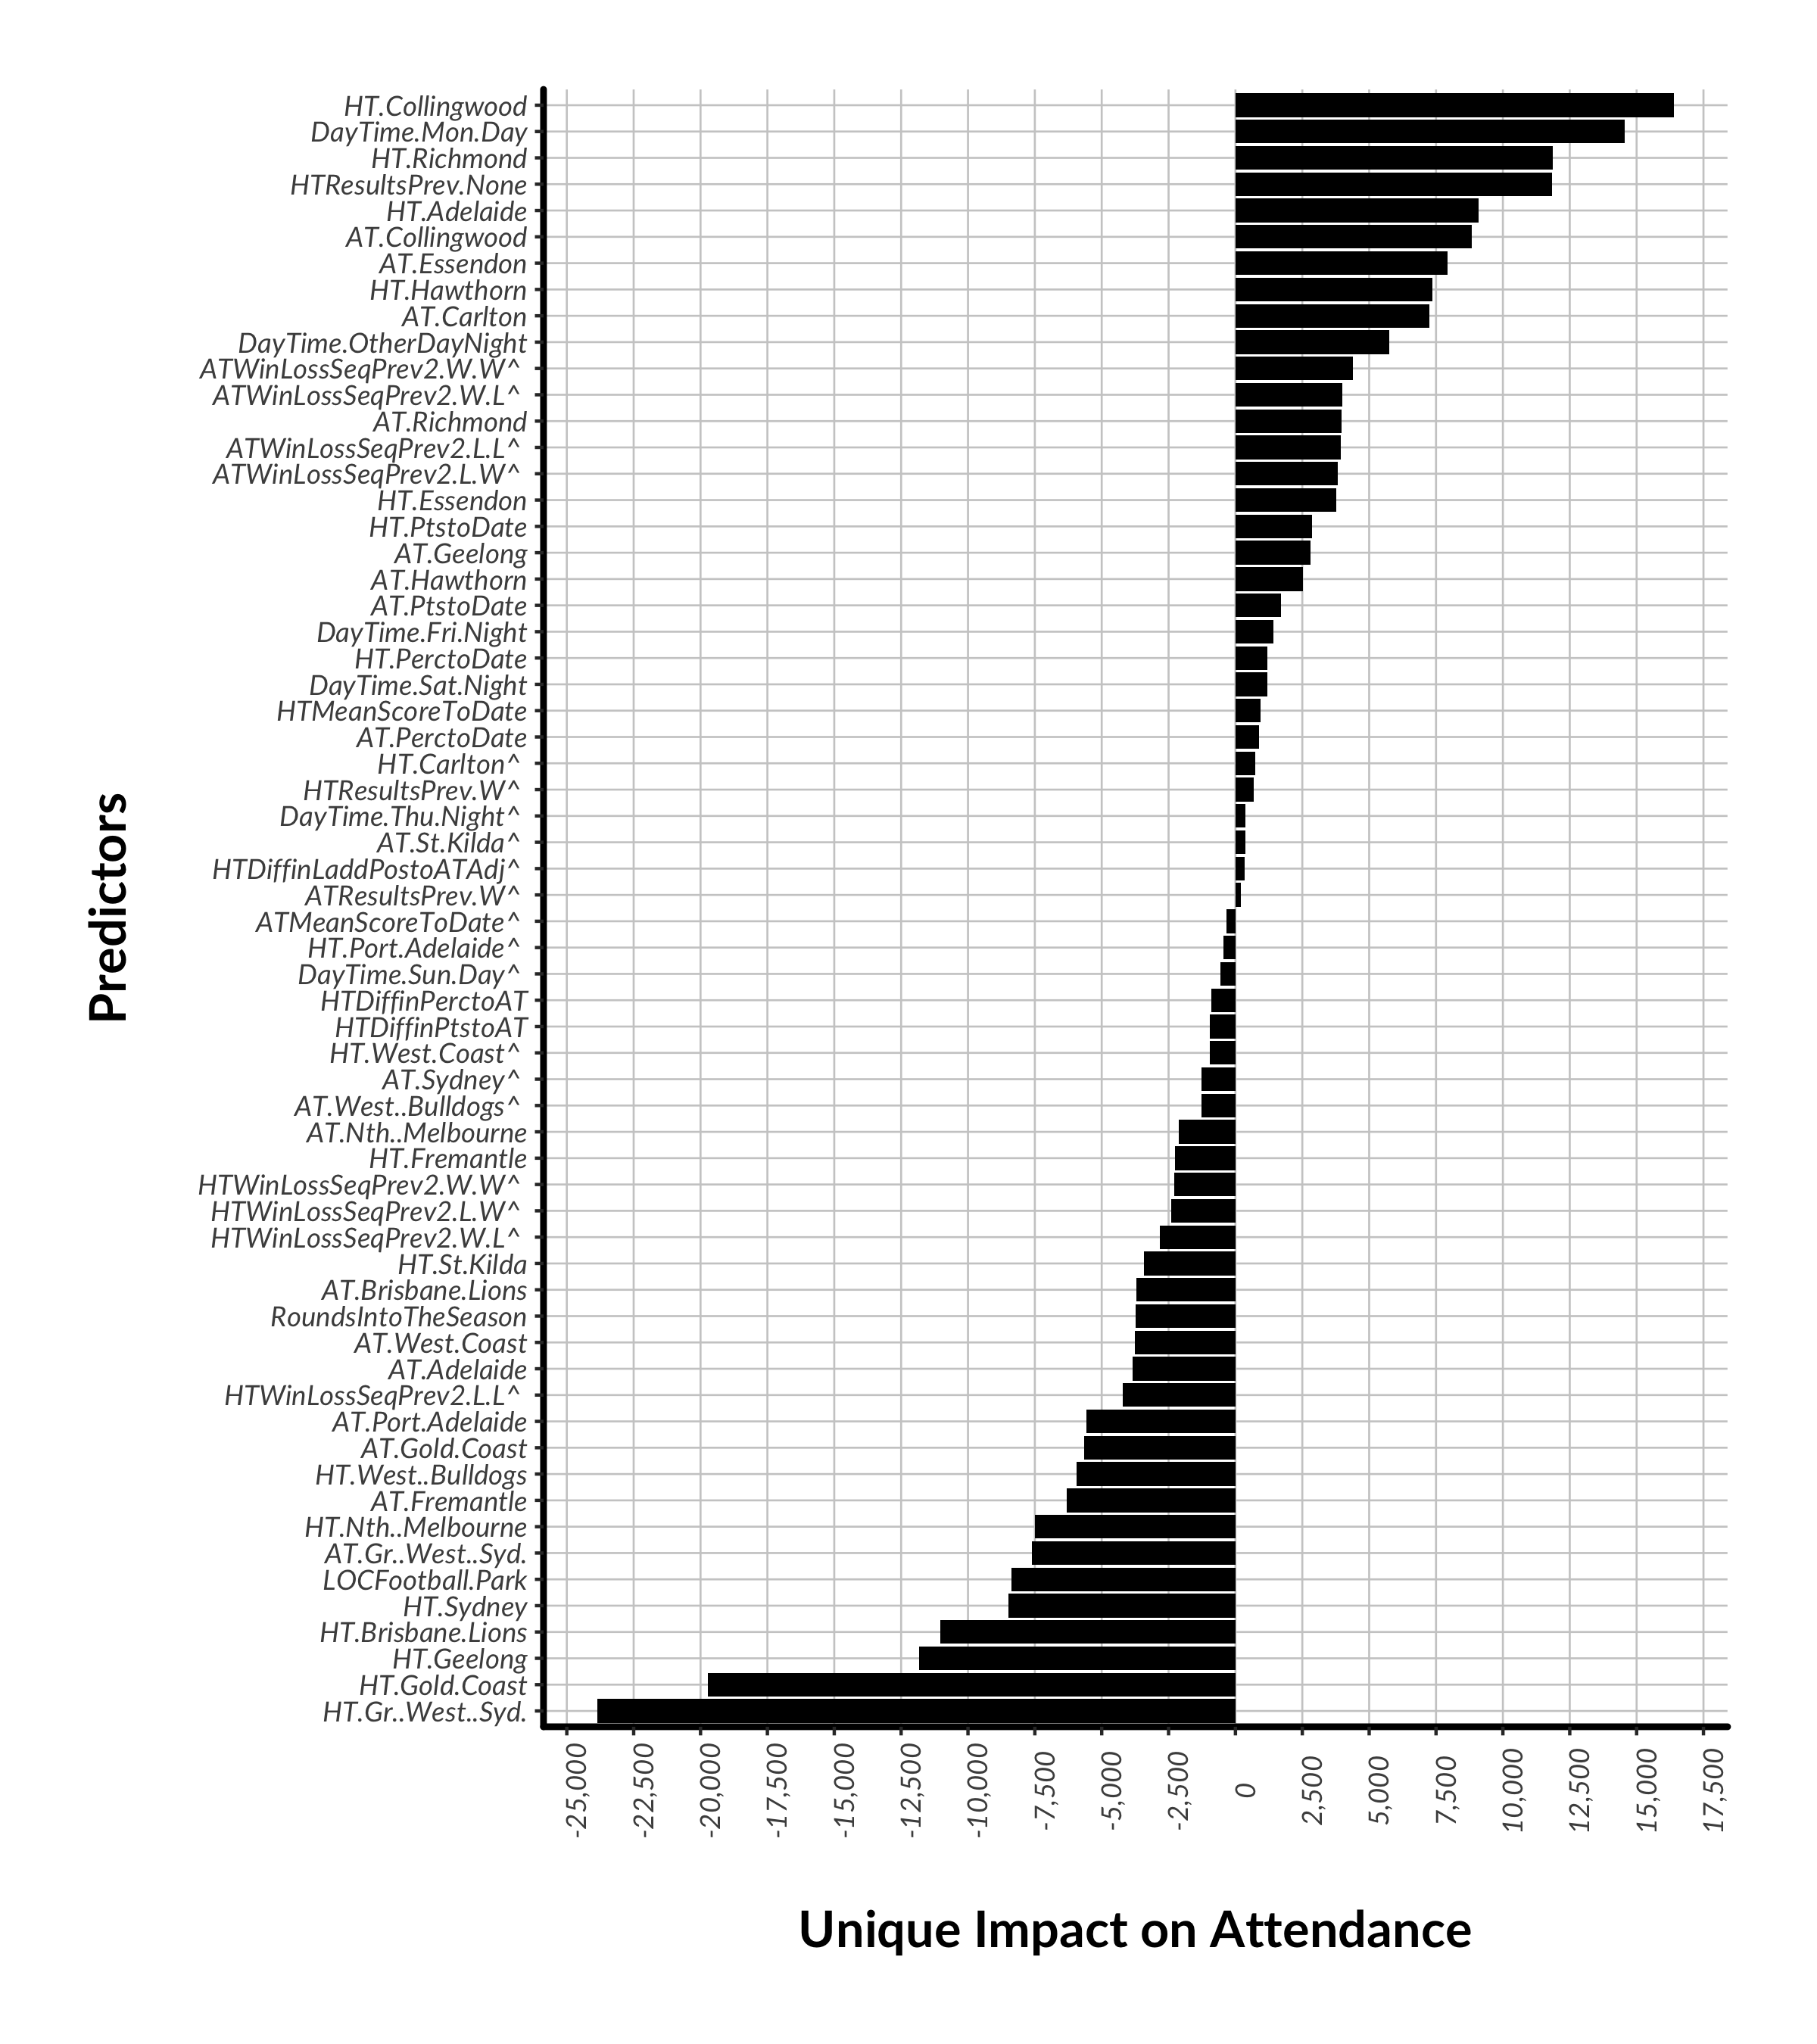
In the chart below, we see that who the away team is can play a large role. No surprises there. If your team is playing Collingwood (ATCollingwood), then that adds 8,845 punters on average. Essendon and Carlton add large numbers too. In contrast, one should expect 7,600 less if the home team is playing Greater Western Sydney (ATGr..West...Syd.).
The day and time of the match makes a difference, with big impacts from “special” event games (DayTime.Mon.Day, DayTime.OtherDayNight). On the other hand, a team playing disproportionately more Sunday games should be compensated by the AFL, with 570 mowing the lawn instead (relative to a Saturday Day fixture). Melbourne Football Club aka "The Sunday Specialists" has claims. Surprisingly, a Friday night game is only worth an extra 1,400 in attendance. So much for the "big stage". It looks like Friday night crowds are only as good as the teams that are playing. There is nothing intrinsically special about it.
Interestingly, a team's run into the match (what happened in the prior round or prior two rounds) has some bearing on on how many turn up but it does not seem to matter much if the away team has had wins or losses in the prior two matches, albeit that the model does not deem these factors “statistically significant”. We need a few more seasons (and more data) to run in order to develop robust conclusions.
Figure 6: Unique impact of factors on true home ground match attendance from 2006 onwards. The baseline category for DayTime is SatDay and therefore DayTime results can be interpreted in relation to this category. ATMelbourne and HTMelbourne were chosen as the baseline category for team-related predictors. HTDiffinLaddPostoATAdj is the difference in ladder position between the home team and the opposition going in to the match, adjusted for the number of teams in the competition in that season. Draws were recoded as losses or "non-wins"). Ladder position was not explicitly included in the model as it was highly correlated with points and percentage.
^indicates a predictor that is not statistically significant - p>0.05
The model also confirms the initial hypothesis that the more wins the home team has (HT.PtstoDate) (shorthand for ladder position), the larger the crowd, even controlling for progress through the season. Each point is worth 3,700, so a win is worth 14,800 more through the gate. Higher points for the away team has a smaller, but significant, impact too (9,200 per win to date). Intuitively, this makes sense, we love to see contests between highly ranked sides.
Note that the difference in ladder position was not a strong predictor (HTDiffinLaddPostoATAdj) but not small either (-1,000 per point). A difference of 1 win is 4,000 less fans which also seems sensible. We like matches between highly ranked, but also closely ranked, teams. However, a match-up between two lowly ranked, but closely matched teams, is relatively less exciting which is why absolute points has a larger effect.
So fans love a contest between two high ranking, closely matched teams (derr, Fred). But these kind of matches are also important when your team is out of the race and you’re looking for something to watch on telly (and this is what the AFL should be aiming for with their scheduling of Friday night games). But how often does this actually occur? Did 2017 actually have more salivating contests than usual? Perhaps this is what made it such a great season. I'll take look a this in the next post: "Part III: Blockbusters & Stinkers".
For the data scientists out there, here’s how different algorithms ranked in terms of RMSE performance. I think a good model might get to an RMSE of 2,500 or better, something you might use to figure out how many pies to pull from the freezer. I’d hope we could get there with the addition of a weather factor. Tree-type models didn’t fare well but I think this has a lot to do with the volume of categorical variables in the set of predictors.
Figure 7: Trialled models to predict home ground match attendance from 2006 onwards. 10-fold cross-validation applied.


